Technical analysis is built around understanding market behavior, momentum changes, and possible price movements before they happen. Among the many concepts used by traders, bullish divergence with the Relative Strength Index (RSI) is one of the most popular methods for identifying potential changes in market momentum.
A bullish divergence RSI signal appears when price movement and momentum indicators move in opposite directions. This difference between price action and momentum can provide valuable information about weakening selling pressure and possible upward movement.
However, many beginners misunderstand bullish divergence. They assume every divergence signal automatically means the price will rise immediately. Professional traders understand that divergence is not a guaranteed reversal signal. Instead, it is a warning sign that market momentum may be changing and requires additional confirmation before making trading decisions.
This complete guide explains bullish divergence RSI from beginner concepts to advanced trading applications, including how it works, different types, identification methods, confirmation techniques, common mistakes, and practical strategies.
Understanding the Relationship Between RSI and Market Momentum
The Relative Strength Index, commonly known as RSI, is a momentum indicator designed to measure the speed and strength of price movements.
RSI was developed to help traders understand whether an asset is gaining or losing momentum. The indicator moves between a value of 0 and 100, creating a visual representation of buying and selling pressure.
The traditional RSI calculation commonly uses a 14-period setting. This means the indicator evaluates the average gains and losses from the previous 14 candles.
When RSI moves higher, it generally indicates increasing buying strength. When RSI declines, it suggests weakening momentum or stronger selling pressure.
Many traders use specific RSI levels:
- RSI above 70 may indicate overbought conditions
- RSI below 30 may indicate oversold conditions
- RSI around 50 represents a balance between buyers and sellers
However, professional traders do not rely only on these levels. An asset can remain overbought during a strong uptrend or oversold during a powerful downtrend. This is why divergence analysis becomes important.
What Bullish Divergence RSI Actually Means
Bullish divergence occurs when price creates a lower low while RSI creates a higher low.
This creates a disagreement between price and momentum.
The market price suggests:
“Selling pressure is increasing because the price continues falling.”
The RSI suggests:
“The downward momentum is becoming weaker compared with the previous decline.”
This difference can indicate that sellers are losing control and buyers may begin entering the market.
A simple example:
Previous price low:
$100
New price low:
$90
Price direction:
Lower low
Previous RSI:
25
New RSI:
35
RSI direction:
Higher low
Although the price dropped further, RSI improved. This shows that the strength behind the decline has weakened.
The Psychology Behind Bullish Divergence
Understanding trader psychology makes divergence easier to understand.
Markets move because of the balance between buyers and sellers. During a strong decline, sellers dominate and prices continue falling.
Eventually, selling pressure begins to reduce.
The price may still make new lows because:
- Existing sellers continue closing positions
- Stop losses are triggered
- Fear remains in the market
However, momentum begins changing underneath the surface.
Fewer traders are willing to sell aggressively.
The RSI detects this reduction in momentum before the price clearly reverses.
This creates the divergence.
The important idea is:
Price shows what happened.
Momentum shows the strength behind what happened.
Bullish divergence reveals that the current downward movement may be losing energy.
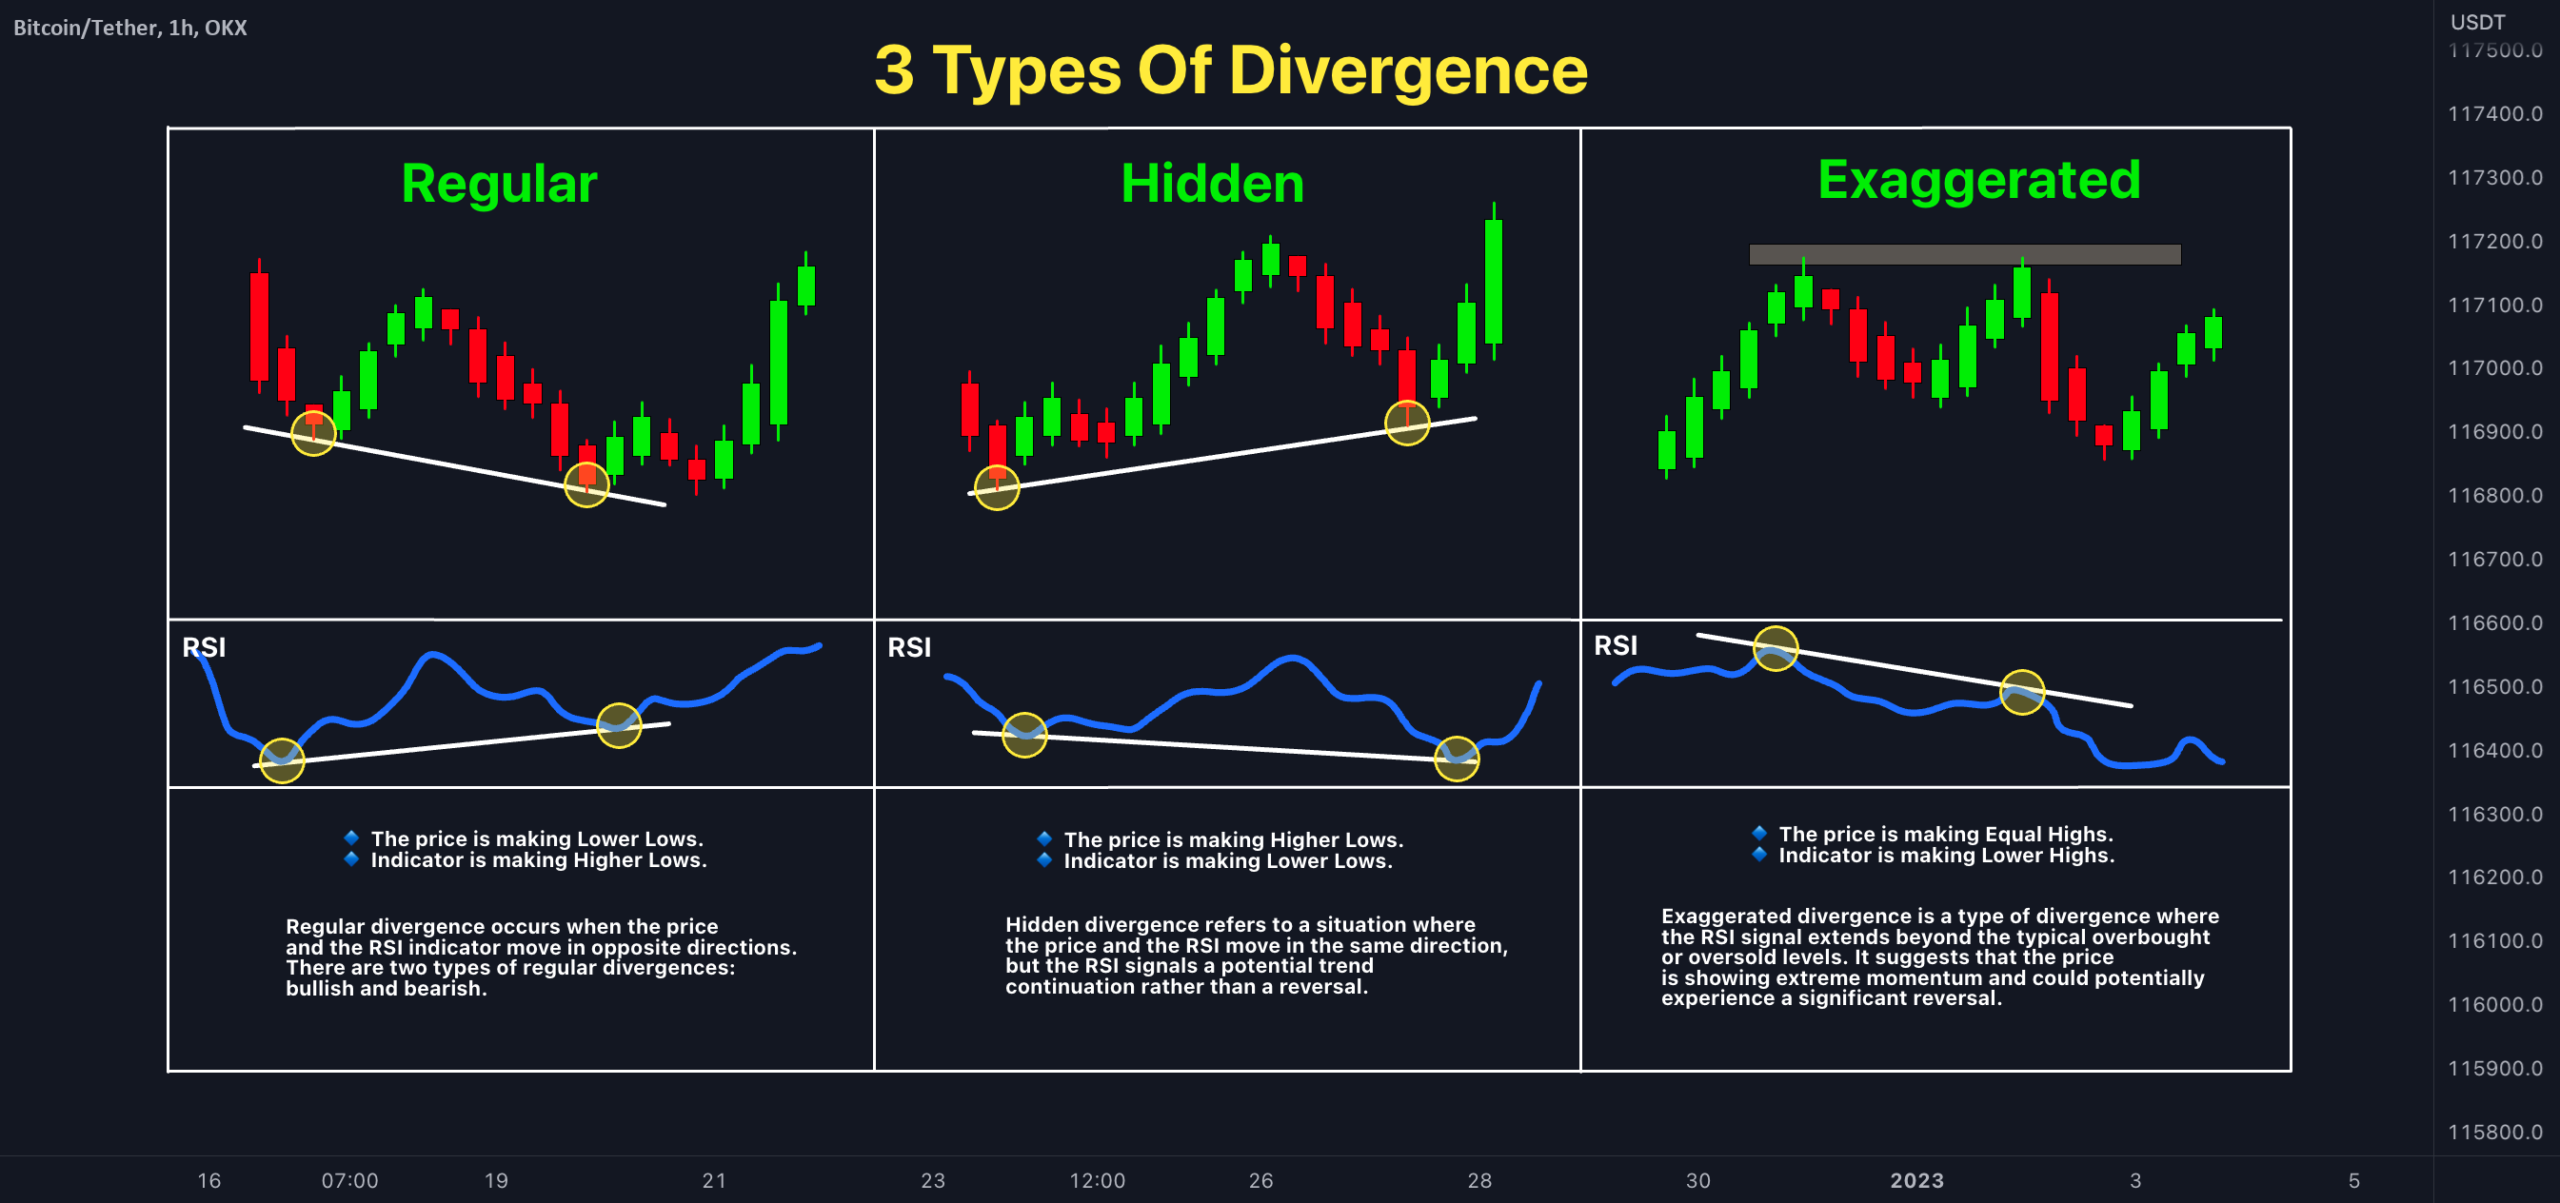
Different Types of Bullish RSI Divergence
Not every bullish divergence works the same way. Traders generally analyze multiple forms depending on market conditions.
Regular Bullish Divergence
Regular bullish divergence is the most commonly discussed type.
It happens when:
Price:
Creates a lower low
RSI:
Creates a higher low
This pattern suggests a possible trend reversal.
Example:
An asset falls from $150 to $120.
After a temporary recovery, it falls again to $110.
The second decline creates a lower price point.
However, RSI improves from 22 to 35.
The sellers pushed price lower, but momentum was weaker.
This can indicate a potential bullish reversal.
Regular bullish divergence is usually strongest when it appears:
- Near major support zones
- After extended declines
- During oversold conditions
- With increasing buying volume
Hidden Bullish Divergence
Hidden bullish divergence is different because it often indicates trend continuation rather than reversal.
It occurs when:
Price:
Creates a higher low
RSI:
Creates a lower low
At first glance, this may seem confusing.
The price is maintaining strength because buyers are protecting higher levels. However, RSI falls because momentum temporarily weakens.
This often appears during healthy corrections in an existing uptrend.
Example:
Price rises from $50 to $80.
It pulls back to $65.
Later, it returns to $70 before continuing upward.
Price created a higher low.
However, RSI falls to a lower level.
This suggests the market may continue its previous bullish trend.
Strong Bullish Divergence
Some traders consider stronger divergence signals when multiple confirmations appear together.
A strong bullish divergence setup may include:
- Lower price low
- Higher RSI low
- Major support zone
- Increased trading volume
- Bullish candlestick formation
- Positive market structure
The more supporting factors present, the stronger the potential setup becomes.
How to Identify Bullish Divergence RSI on a Chart
Finding divergence requires comparing price action and RSI movement.
A proper identification process includes several steps.
Step One: Locate Significant Price Lows
Do not compare random candles.
The first step is finding important swing lows.
A meaningful low usually has:
- Strong price rejection
- Increased volume
- Previous support importance
- Clear movement away afterward
Small temporary lows often create unreliable signals.
Step Two: Compare Two Major Lows
After identifying two lows, compare their positions.
Ask:
Did price create a lower low?
If yes, continue analyzing.
If price creates equal or higher lows, the setup may represent a different pattern.
Step Three: Analyze RSI Movement
Now examine RSI.
Ask:
Did RSI create a higher low?
If price declined but RSI improved, bullish divergence may exist.
Step Four: Wait for Confirmation
The biggest mistake beginners make is entering immediately after spotting divergence.
A divergence signal should usually be confirmed through additional evidence.
Possible confirmation methods include:
- Bullish candlestick patterns
- Breakout above resistance
- Moving average support
- Volume increase
- Market structure change
Best Timeframes for Bullish Divergence RSI Trading
The reliability of divergence often depends on timeframe selection.
Different traders use different approaches.
Lower Timeframes
Examples:
- 1-minute charts
- 5-minute charts
- 15-minute charts
Advantages:
- More trading opportunities
- Useful for scalping
Disadvantages:
- More false signals
- Higher market noise
Short-term traders should use stronger confirmation methods.
Medium Timeframes
Examples:
- 1-hour charts
- 4-hour charts
These are popular among swing traders.
Benefits include:
- Better signal quality
- Less market noise
- More manageable trading frequency
Higher Timeframes
Examples:
- Daily charts
- Weekly charts
Higher timeframe divergence is often considered more meaningful because larger market participants influence these movements.
Advantages:
- Stronger signals
- Larger potential moves
- Less emotional decision-making
The disadvantage is fewer opportunities.
Bullish Divergence RSI Trading Strategy Framework
A complete trading approach requires more than simply finding divergence.
A structured strategy can include:
Market Condition Analysis
Before looking for divergence, determine the overall market environment.
Ask:
Is the asset trending?
Is it near important support?
Is the market extremely weak or simply experiencing a normal correction?
Divergence works differently in different conditions.
A bullish divergence during a long-term uptrend pullback is often different from divergence during a falling market.
Entry Confirmation Method
Possible entry signals include:
Break Above Resistance
Wait for price to break above a short-term resistance level after divergence forms.
This confirms buyers are gaining control.
Bullish Candlestick Confirmation
Examples:
- Hammer candle
- Bullish engulfing pattern
- Strong closing candle
These patterns show increased buying interest.
RSI Recovery Above Key Levels
Some traders wait for RSI to move back above 40 or 50 before entering.
This indicates improving momentum.
Stop Loss Placement
Risk management is essential.
A common approach is placing a stop loss below:
- Recent swing low
- Support zone
- Divergence formation point
The goal is protecting capital if the expected reversal fails.
Profit Target Methods
Possible targets include:
- Previous resistance levels
- Moving averages
- Fibonacci retracement zones
- Risk-reward calculations
A good trading plan defines exit points before entering.