
The hammer candle is one of the most recognized candlestick patterns in technical analysis. Traders often use it to identify potential bullish reversals after a downtrend. Although it consists of only a single candle, its appearance can provide valuable insight into market sentiment.
When correctly identified and confirmed, this pattern may help traders spot possible buying opportunities. However, understanding the context behind the formation is essential.
In this guide, you’ll learn how the hammer candle works, how to identify it, its psychology, trading strategies, advantages, limitations, and common mistakes to avoid.
What Is a Hammer Candle?
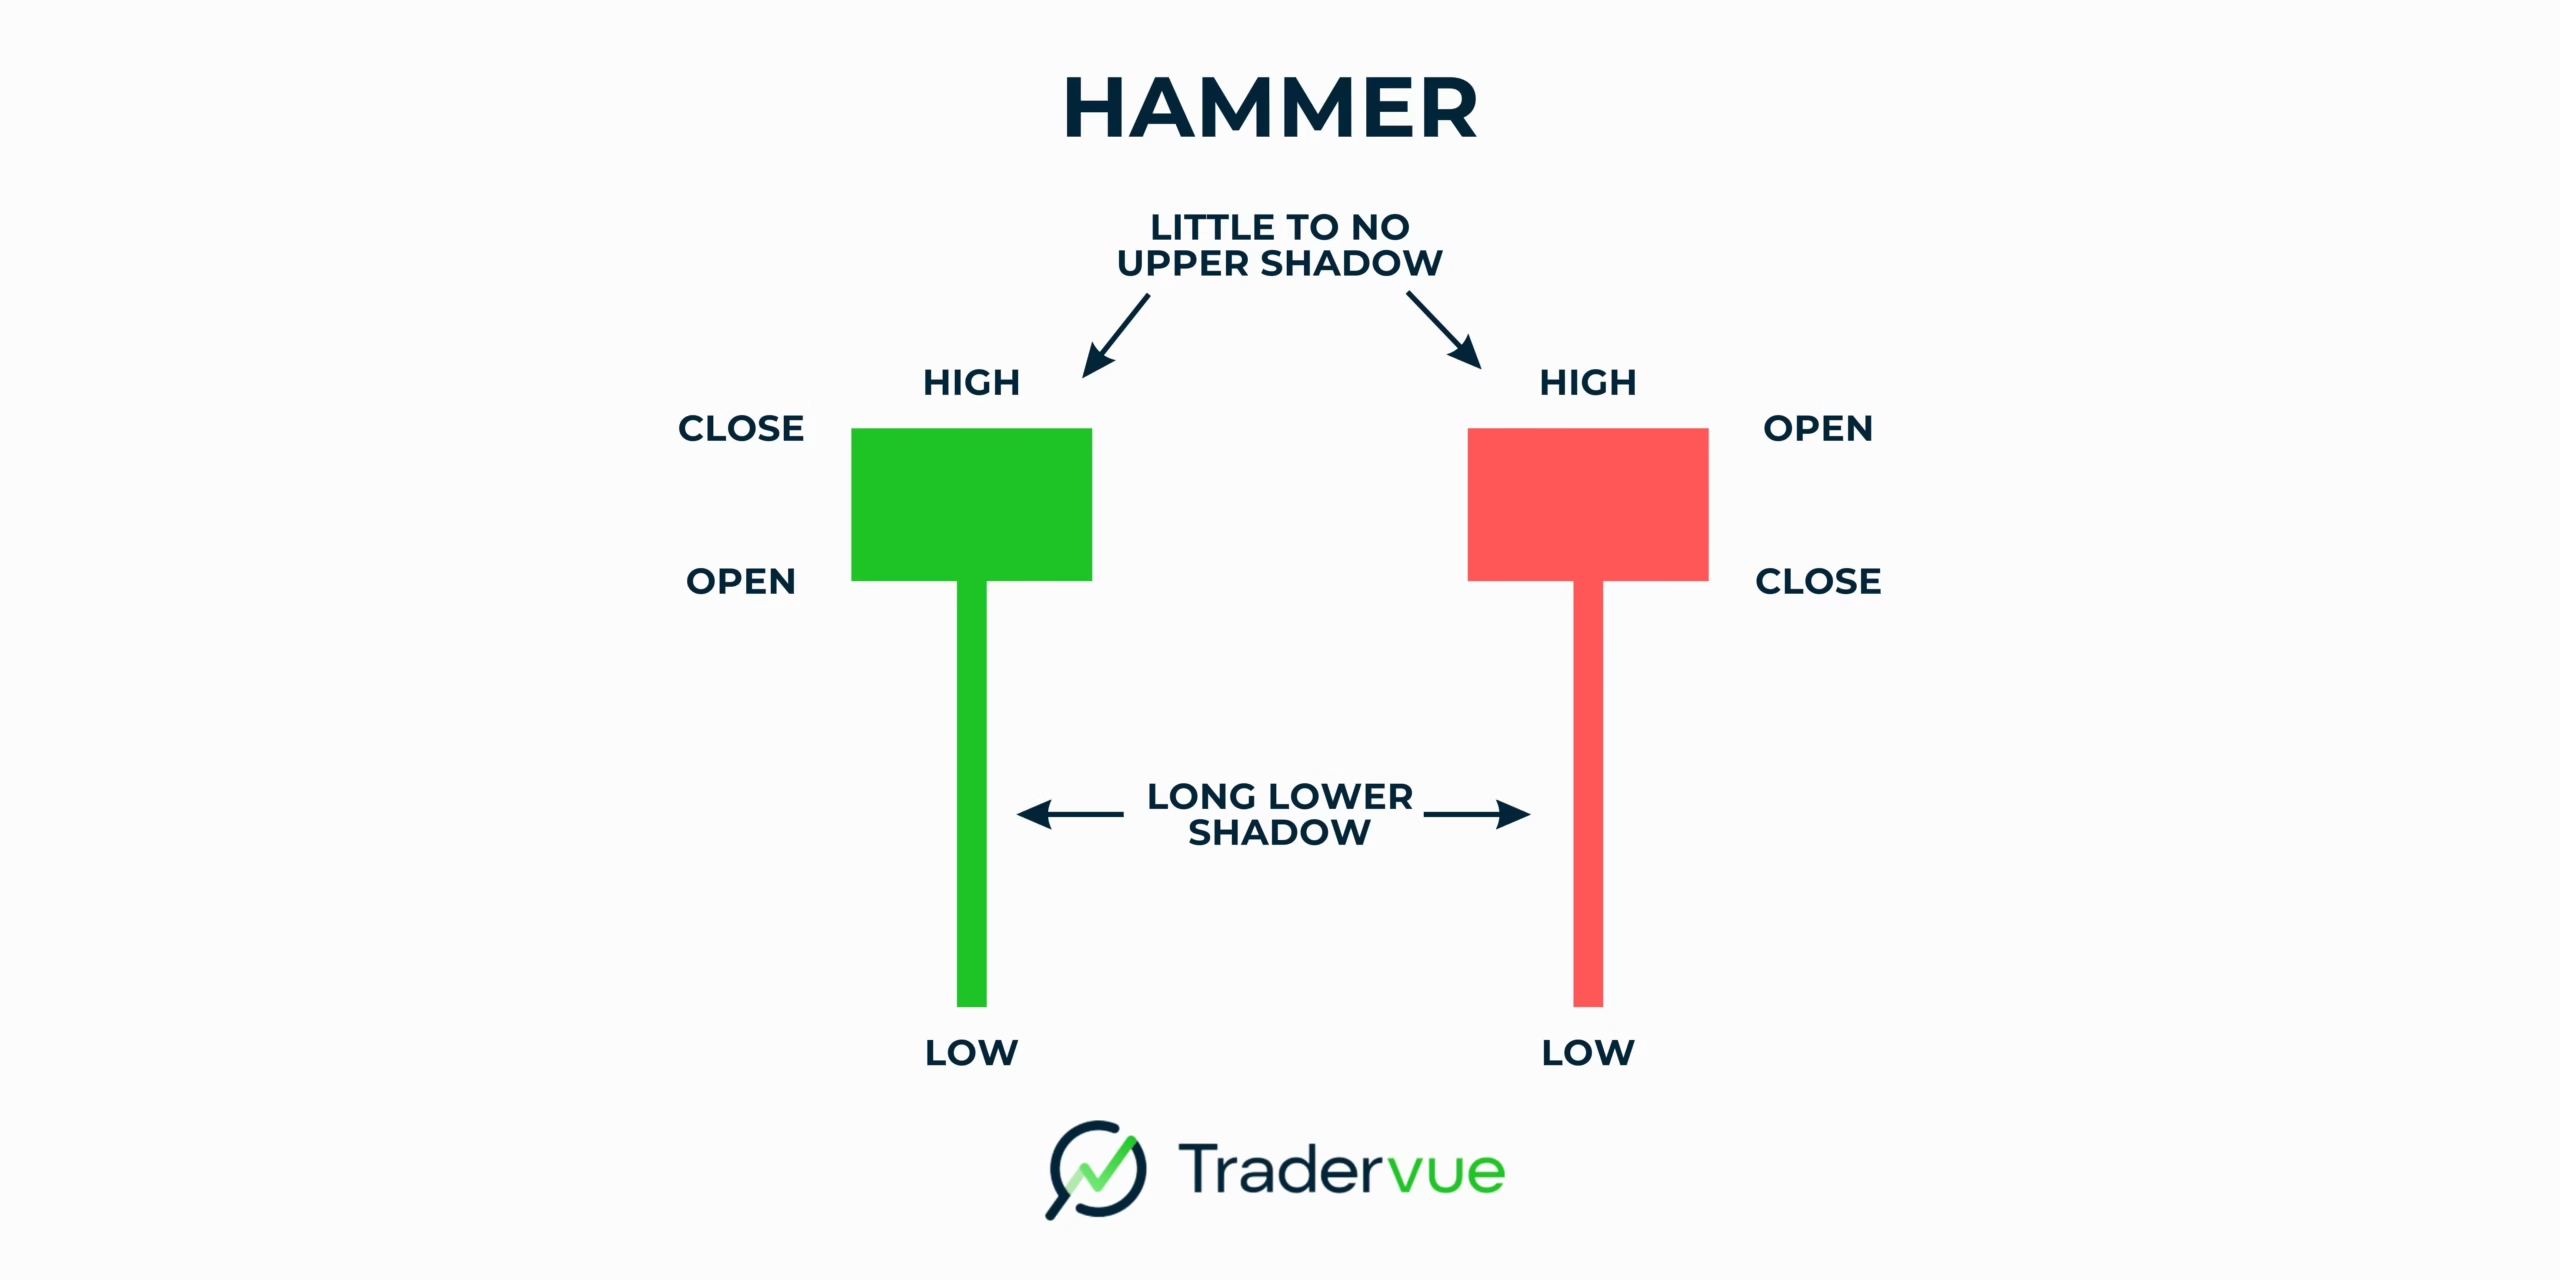
A hammer candle is a bullish reversal candlestick pattern that usually forms after a price decline. It features a small real body near the top of the candle and a long lower shadow that is at least twice the size of the body.
This structure indicates that sellers pushed prices lower during the trading session. However, buyers regained control and forced the price back toward the opening level before the session ended.
As a result, the market shows signs that selling pressure may be weakening.
Key Characteristics of a Hammer Candle
- Small real body near the top
- Long lower wick
- Little or no upper wick
- Forms after a downtrend
- Signals potential bullish reversal
The pattern becomes more reliable when it appears near a strong support level and receives confirmation from subsequent price action.
How to Identify a Hammer Candlestick Pattern
Recognizing a valid hammer candlestick pattern requires more than spotting a long wick.
Traders should evaluate the overall market context before making decisions.
Essential Identification Rules
A valid hammer generally includes:
- A lower shadow at least two times the body size
- A small candle body near the session high
- Minimal upper shadow
- A clear preceding downtrend
Without a prior downtrend, the pattern loses much of its significance.
Example Scenario
Imagine a stock falling for several consecutive sessions.
During the next session:
- Sellers push the price significantly lower.
- Buyers enter aggressively.
- The price closes near its opening level.
This creates the characteristic hammer candle shape and suggests a potential shift in momentum.
Psychology Behind the Hammer Candle
Understanding trader psychology helps explain why this pattern attracts attention.
Initially, sellers dominate the market and drive prices downward.
However, buyers begin to view lower prices as attractive. They enter the market and absorb selling pressure.
By the close of the session:
- Buyers regain control.
- Sellers lose momentum.
- Confidence starts shifting toward bullish sentiment.
This battle between buyers and sellers creates the long lower shadow that defines the hammer candle.
The stronger the recovery from the session low, the more meaningful the signal becomes.
Hammer Candle Trading Strategy
A hammer candle alone should not be used as a buy signal.
Professional traders typically wait for confirmation before entering a trade.
Step 1: Identify the Pattern
Look for the pattern after a clear downtrend.
The setup becomes stronger if it forms near:
- Support zones
- Trendlines
- Fibonacci retracement levels
- Major moving averages
Step 2: Wait for Confirmation
Confirmation occurs when the next candle closes above the hammer’s high.
This indicates buyers remain in control.
Step 3: Enter the Trade
Many traders enter after confirmation rather than immediately after the pattern forms.
This reduces the risk of false signals.
Step 4: Place a Stop Loss
A common stop-loss location is:
- Below the hammer’s low
This protects capital if the reversal fails.
Step 5: Set Profit Targets
Profit targets can be based on:
- Previous resistance levels
- Risk-to-reward ratios
- Technical indicators
Proper risk management remains essential.
Using Confirmation Indicators with a Hammer Candle
Confirmation increases the reliability of any trading setup.
Several indicators work well alongside a hammer candle.
Relative Strength Index (RSI)
RSI helps identify oversold conditions.
If the pattern forms while RSI is below 30, the probability of a reversal may improve.
Volume Analysis
High trading volume suggests stronger buying interest.
A high-volume hammer candle often carries more significance than one formed on low volume.
Moving Averages
Moving averages help identify broader trends.
A bullish signal becomes stronger when price reclaims an important moving average after the pattern forms.
Support Levels
Support zones represent areas where buyers previously entered the market.
When a hammer candlestick pattern appears at support, traders often pay closer attention.
Hammer Candle vs Inverted Hammer
Many beginners confuse these two patterns.
Although both may indicate bullish reversals, they look different.
Hammer Candle
Features:
- Long lower wick
- Small body near the top
- Little upper wick
This shows strong rejection of lower prices.
Inverted Hammer
Features:
- Long upper wick
- Small body near the bottom
- Small lower wick
This suggests buyers tested higher prices but still require confirmation.
Both patterns can signal reversals, but the traditional hammer candle generally receives more attention from traders.
Advantages of Trading the Hammer Candle
The popularity of this pattern comes from several practical benefits.
Easy to Identify
Even beginner traders can learn to recognize it quickly.
Works Across Markets
The pattern appears in:
- Stocks
- Forex
- Commodities
- Cryptocurrency
- Indices
Supports Risk Management
Its structure provides a logical location for stop-loss placement.
Combines Well with Indicators
Traders can easily integrate it with technical analysis tools.
Because of these benefits, many traders include the hammer candle in their trading plans.
Limitations of the Hammer Candle
Despite its popularity, no candlestick pattern guarantees success.
Understanding limitations is important.
False Signals
Not every pattern leads to a reversal.
Some simply represent temporary price fluctuations.
Requires Confirmation
Entering immediately can increase risk.
Confirmation remains crucial.
Market Conditions Matter
The pattern performs differently depending on:
- Market volatility
- Trend strength
- Trading volume
Not Effective in Sideways Markets
A hammer candlestick pattern within a ranging market often lacks predictive value.
Always evaluate broader market context.
Common Mistakes Traders Make
Avoiding mistakes can improve trading results significantly.
Ignoring the Trend
The pattern should appear after a downtrend.
Without a decline beforehand, its meaning changes.
Skipping Confirmation
Many traders enter too early.
Waiting for confirmation often improves reliability.
Ignoring Volume
Volume provides valuable clues about market participation.
Overtrading
Not every hammer candle deserves a trade.
Quality setups outperform quantity.
Forgetting Risk Management
Even high-probability setups can fail.
Always define risk before entering a position.
Best Timeframes for Hammer Candle Analysis
The pattern can appear on any timeframe.
However, reliability often increases on higher timeframes.
Intraday Charts
Useful for:
- Day traders
- Scalpers
Signals occur frequently but may generate more noise.
Four-Hour Charts
A balanced choice for swing traders.
Provides a good mix of reliability and opportunity.
Daily Charts
Often considered the most reliable timeframe.
Many institutional traders monitor daily price action.
Choose the timeframe that matches your trading strategy and risk tolerance.
Real-World Example of a Hammer Candle
Suppose a stock declines for several days and reaches a major support level.
During the next trading session:
- Sellers push prices lower.
- Buyers aggressively enter.
- The session closes near the high.
The resulting hammer candle signals potential exhaustion among sellers.
The following day, price closes above the hammer’s high.
This confirmation encourages traders to consider long positions while placing stop losses below the candle’s low.
This example demonstrates how context and confirmation work together.
Frequently Asked Questions
1. Is a hammer candle bullish or bearish?
A hammer candle is generally considered a bullish reversal pattern when it forms after a downtrend.
2. How reliable is a hammer candlestick pattern?
Reliability improves when the pattern forms at support levels and receives confirmation from the next candle.
3. Can beginners trade using a hammer candle?
Yes. The pattern is relatively easy to identify and understand, making it suitable for beginners.
4. What indicators work best with a hammer candle?
RSI, volume analysis, support levels, and moving averages are commonly used alongside the pattern.
5. What is the difference between a hammer candle and a hanging man?
Both look similar. However, a hammer appears after a downtrend, while a hanging man forms after an uptrend and may signal bearish weakness.
Conclusion
The hammer candle remains one of the most valuable candlestick patterns for identifying potential bullish reversals. Its unique shape reflects a shift in control from sellers to buyers and offers traders insight into changing market sentiment.
However, successful trading requires more than recognizing a pattern. Confirmation, support levels, volume analysis, and proper risk management all play important roles.
Rather than treating the hammer candle as a guaranteed buy signal, use it as part of a broader trading strategy. When combined with technical analysis and disciplined execution, it can become a useful tool in your decision-making process.
Start applying these concepts on historical charts and practice identifying quality setups before risking real capital.