The inverse cup and handle pattern is one of the most recognized bearish formations in technical analysis. Traders use this chart pattern to identify potential downward price movements and possible selling opportunities. Although it resembles the traditional cup and handle pattern, its interpretation is completely different.
When identified correctly, the pattern can help traders spot trend continuation opportunities during bearish market conditions. However, many beginners struggle to recognize valid setups and often enter trades too early.
This guide explains everything you need to know about the inverse cup and handle pattern. You’ll learn how it forms, why it works, how to trade it effectively, and which mistakes to avoid when using it in real market conditions.
What Is an Inverse Cup and Handle Pattern?
The inverse cup and handle is a bearish chart formation that signals the potential continuation of a downward trend.
The pattern consists of two primary components:
- An inverted rounded cup
- A smaller upward retracement called the handle
After the handle forms, price often breaks below support and continues moving lower.
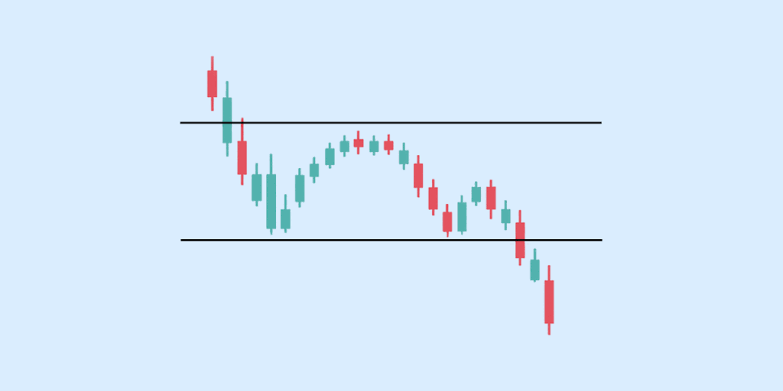
Structure of the Pattern
The cup develops when sellers gradually regain control after a temporary recovery.
Price then forms a small upward correction that creates the handle.
Finally, a breakdown below support confirms the pattern.
Why Traders Watch This Pattern
Many traders monitor this setup because it provides:
- Clear entry opportunities
- Defined stop-loss levels
- Measurable profit targets
- Strong bearish confirmation
As a result, the inverse cup and handle remains a popular tool among technical traders.
The Psychology Behind Bearish Chart Patterns
Understanding market psychology helps explain why the pattern works.
Seller Dominance
The rounded cup shows that buying momentum is weakening.
Although buyers attempt to push prices higher, they fail to maintain control.
Gradually, sellers regain influence and begin driving prices lower.
The False Recovery
The handle often creates false optimism.
Many traders believe the market is recovering.
However, institutional sellers frequently use this period to increase positions before another decline.
Breakdown Confirmation
Once support breaks, fear often increases.
Additional selling pressure enters the market.
Consequently, the inverse cup and handle can produce strong downside momentum when confirmed.
Understanding these psychological factors improves pattern recognition and trade execution.
How to Identify the Pattern Using Technical Analysis
Recognizing a valid setup requires patience and attention to detail.
Step 1: Locate a Downtrend
The strongest patterns usually appear after an existing bearish trend.
Trend direction provides important context.
Step 2: Identify the Rounded Cup
Look for a smooth inverted curve rather than sharp price swings.
A gradual formation often signals stronger reliability.
Step 3: Find the Handle
The handle should form as a modest upward retracement.
Excessively large handles may reduce pattern quality.
Step 4: Watch Support Levels
Support represents the key breakout area.
A decisive breakdown strengthens the signal.
Using proper technical analysis pattern techniques helps traders avoid false signals and improve consistency.
Trading the Inverse Cup and Handle Effectively
A successful trading approach requires more than simply spotting the pattern.
Entry Strategy
Many traders wait for confirmation before entering.
Common triggers include:
- Daily close below support
- Increased selling volume
- Strong bearish candles
Stop-Loss Placement
Risk management is critical.
Popular stop-loss locations include:
- Above the handle high
- Above recent resistance
- Above breakdown invalidation levels
Profit Targets
Many traders calculate targets using the depth of the cup.
This distance is projected downward from the breakout point.
Applying a disciplined breakout trading strategy helps maintain consistency over time.
Volume Analysis and Confirmation Signals
Volume plays an important role in validating chart patterns.
During Cup Formation
Volume often decreases while the cup develops.
This indicates weakening buyer participation.
During Handle Formation
Trading activity frequently remains moderate.
Neither side gains complete control.
During the Breakdown
A significant increase in volume strengthens confirmation.
Strong participation suggests sellers are aggressively entering the market.
Without proper confirmation, the inverse cup and handle may fail and reverse unexpectedly.
Therefore, traders should avoid relying solely on price action.
Risk Management for Pattern Traders
Even reliable setups can fail.
Position Sizing
Never risk excessive capital on a single trade.
Many professional traders limit risk to a small percentage of their portfolio.
Risk-to-Reward Ratio
Before entering a position, evaluate potential reward relative to risk.
A favorable ratio improves long-term profitability.
Avoid Emotional Trading
Fear and greed often lead to poor decisions.
Stick to predefined rules.
Use Trading Plans
A written plan helps maintain discipline.
It should include:
- Entry conditions
- Stop-loss rules
- Profit objectives
- Trade management guidelines
Proper risk management can be more important than the inverse cup and handle pattern itself.
Common Mistakes Traders Make
Many beginners misuse bearish chart formations.
Entering Before Confirmation
Premature entries increase the risk of false breakdowns.
Wait for clear confirmation whenever possible.
Ignoring Market Context
Patterns perform better when aligned with broader market trends.
Always evaluate the overall environment.
Overlooking Volume
Volume confirmation strengthens reliability.
Ignoring it may lead to poor trade selection.
Using Large Position Sizes
Even high-probability setups fail.
Risk should remain controlled at all times.
Avoiding these mistakes can significantly improve trading performance.
Inverse Cup and Handle vs Regular Cup and Handle
Although their names are similar, the patterns have opposite implications.
Regular Cup and Handle
Characteristics include:
- Bullish outlook
- Upward breakout
- Trend continuation potential
Inverse Cup and Handle
Characteristics include:
- Bearish outlook
- Downward breakout
- Selling opportunities
Understanding these differences prevents confusion during chart analysis.
Both patterns remain important components of stock market patterns and technical trading systems.
FAQs
What is an inverse cup and handle pattern?
The inverse cup and handle is a bearish chart formation that signals a potential continuation of a downward trend after support breaks.
Is the inverse cup and handle reliable?
The pattern can be reliable when confirmed by volume, market context, and a decisive breakout below support.
What timeframe works best for this pattern?
Traders use the pattern on multiple timeframes, although higher timeframes generally provide stronger signals.
How do you calculate a price target?
Many traders measure the depth of the cup and project that distance downward from the breakout level.
Can beginners trade the inverse cup and handle?
Yes, but beginners should focus on confirmation signals, risk management, and practice before using real capital.
Conclusion
The inverse cup and handle pattern remains one of the most useful bearish formations in technical analysis. Its structure provides traders with clear entry points, logical stop-loss locations, and measurable profit objectives. When combined with volume analysis, market context, and disciplined execution, the pattern can become a valuable part of a trading strategy.
However, no chart setup guarantees success. Traders should always confirm signals, manage risk carefully, and avoid emotional decision-making. Consistency comes from following a structured process rather than relying on a single indicator.
Whether you are new to chart analysis or an experienced trader refining your approach, understanding the inverse cup and handle can help improve market awareness and trading confidence. Start applying these concepts in your chart studies and practice identifying high-quality setups before entering live trades.